

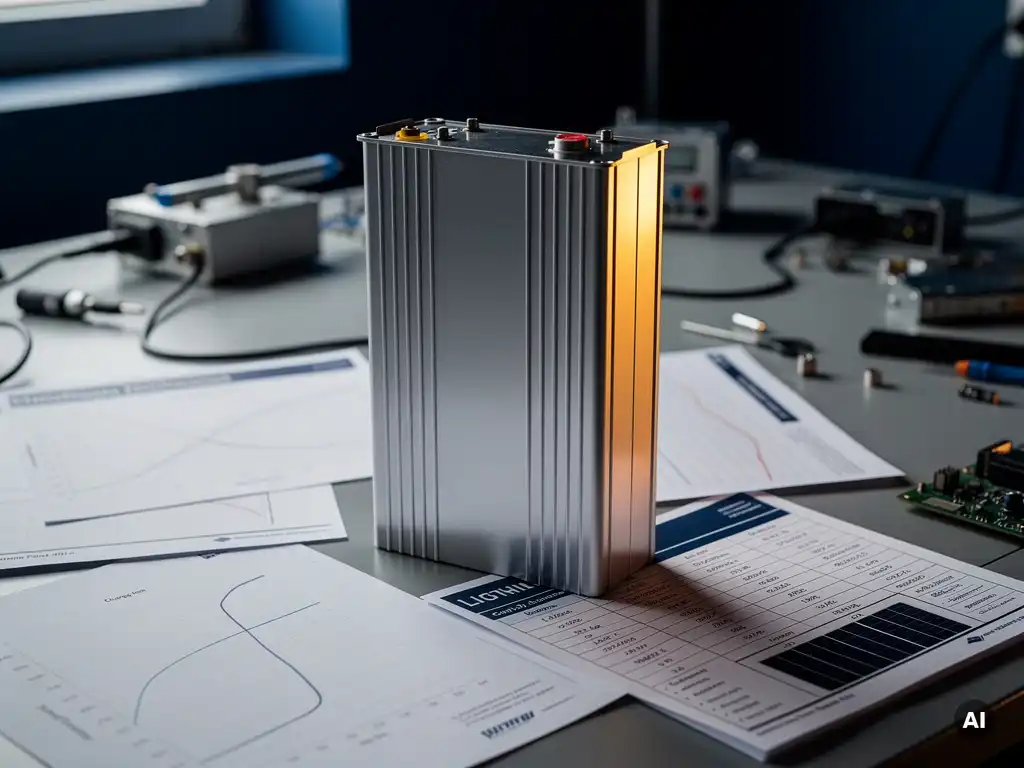
C-rate is a standardized measure of how quickly a battery charges or discharges relative to its total capacity, and it directly determines how much usable power a battery can deliver at any given moment. A battery rated at 1C can fully discharge in one hour, while a 0.5C rating means it takes two hours. For solar professionals involved in battery sizing, understanding C-rate is essential because it defines both the power output a system can sustain and how long the battery will actually last in the field.
The sections below walk through the most important questions engineers and designers ask when working with C-rate in the context of commercial and utility-scale solar storage projects.
How does C-rate actually determine battery performance?
C-rate determines battery performance by defining the relationship between discharge speed and the energy a battery can actually deliver. The faster a battery discharges, the less total energy it provides. This is because internal resistance generates heat at higher discharge rates, reducing the effective capacity available to the system. In practical terms, a battery discharged at 2C will deliver noticeably less energy than the same battery discharged at 0.5C.
This relationship is not linear and varies significantly between battery chemistries. Lithium iron phosphate (LFP) batteries, which are increasingly common in commercial solar storage, handle higher C-rates with relatively modest capacity loss compared to older lead-acid technologies. However, even with LFP, pushing discharge rates beyond the manufacturer’s recommended C-rate will reduce round-trip efficiency and accelerate degradation over time.
For engineers sizing a battery system, this means the nameplate capacity is only part of the story. The actual usable capacity depends on the C-rate at which the system will operate during peak demand periods. Ignoring this relationship is one of the most common causes of undersized storage systems that underperform at commissioning.
What does a C-rate number mean in practice?
A C-rate number expresses the charge or discharge current as a multiple of the battery’s total capacity. A 100 kWh battery discharging at 1C delivers 100 kW of power for one hour. The same battery at 0.5C delivers 50 kW for two hours, and at 2C it delivers 200 kW but only for approximately 30 minutes. The number itself is a ratio, not a fixed unit, which makes it universally applicable across battery sizes.
In practice, most commercial solar storage systems are designed to operate between 0.25C and 1C during normal cycling. Systems that need to respond to rapid demand peaks, such as those providing frequency regulation or demand charge management, may require burst discharge rates of 1C to 2C for short durations. Systems focused on overnight energy shifting typically operate at lower C-rates, prioritizing capacity over power delivery speed.
When reviewing battery datasheets, you will often see the capacity listed alongside the C-rate at which it was tested. A battery rated at 200 kWh at 0.2C may only deliver 180 kWh at 1C. Always confirm which C-rate the manufacturer used when specifying capacity, and use that figure as the baseline for your sizing calculations.
Why does C-rate matter when sizing a solar battery system?
C-rate matters in battery sizing because it determines whether a battery can meet both the energy and power requirements of the application simultaneously. A system sized purely on energy capacity, without accounting for the required discharge rate, may have enough stored energy but be unable to deliver it fast enough to meet peak load demands. Getting this wrong leads to either undersized power output or oversized and unnecessarily expensive battery banks.
Consider a commercial facility with a peak demand of 500 kW that needs to be covered for two hours. A naive sizing approach might specify a 1,000 kWh battery and call it done. But if the selected battery chemistry is only rated for continuous discharge at 0.5C, the maximum power output is 500 kW, which leaves zero margin. Any demand spike above that threshold causes the system to fall short. A more robust design would account for the C-rate ceiling and either select a battery with a higher continuous rating or add capacity to reduce the operating C-rate.
For utility-scale projects, C-rate also affects how the battery interacts with the inverter and grid connection. The inverter must be sized to handle the maximum discharge current the battery can produce, and the DC/AC ratio of the system needs to reflect realistic operating C-rates rather than theoretical peak values. These are exactly the kinds of interdependent calculations that benefit from automated design tools rather than manual spreadsheet work.
What’s the difference between continuous and peak C-rate ratings?
Continuous C-rate is the discharge rate a battery can sustain indefinitely without damage or significant capacity loss, while peak C-rate is the maximum rate the battery can handle for short bursts, typically measured in seconds to a few minutes. Both figures appear on battery datasheets, and both matter for system design, but they serve different purposes in the sizing process.
The continuous C-rate defines the baseline power the battery can reliably deliver throughout a normal discharge cycle. This is the figure to use when calculating whether the battery can meet sustained load requirements, such as covering overnight consumption or providing consistent power during grid outages. Exceeding the continuous C-rate for extended periods causes overheating, accelerated degradation, and, in some cases, safety risks.
The peak C-rate is relevant for applications where short, high-power bursts are needed, such as motor starting loads, demand response events, or frequency regulation services. A battery might have a continuous rating of 0.5C but a peak rating of 2C for up to 10 seconds. Designing a system that relies on peak C-rate for anything beyond those brief intervals is a specification error that will show up as premature battery failure in the field.
When comparing battery products, always verify that the continuous and peak ratings are tested under the same temperature and state-of-charge conditions. Manufacturers sometimes publish peak figures measured under ideal laboratory conditions that do not reflect real-world operating environments.
How does C-rate affect battery lifespan and cycle count?
Higher C-rates reduce battery lifespan by increasing internal heat generation and mechanical stress on the electrode materials during each charge and discharge cycle. The relationship is consistent across battery chemistries: a battery cycled at 1C will typically reach its end-of-life cycle count faster than the same battery cycled at 0.5C, even if the total energy throughput is similar. Reducing the operating C-rate is one of the most effective ways to extend battery service life without changing the battery itself.
For commercial and utility-scale solar projects, where battery replacement represents a significant capital cost, this trade-off has real financial implications. A battery system designed to operate at a conservative C-rate may require a larger initial investment in capacity, but that investment is often recovered through extended service life and reduced replacement frequency over the project’s 20- to 25-year horizon.
Cycle count warranties from manufacturers are typically specified at a defined C-rate. If the actual operating C-rate exceeds the warranty condition, the cycle count guarantee may not apply. Always cross-reference the warranty terms with the intended operating profile before finalizing a battery specification, and document the expected C-rate in the system design so that operations teams can monitor actual usage against the design assumption.
Which C-rate is right for a commercial or utility-scale solar project?
For most commercial and utility-scale solar storage applications, a continuous C-rate between 0.25C and 0.5C is the practical target range for energy-focused use cases such as self-consumption optimization, peak shaving, and overnight load shifting. Applications that require fast response, such as frequency regulation or demand charge management with sharp demand spikes, may justify continuous ratings up to 1C, provided the battery chemistry supports it without significant capacity loss.
The right C-rate for a specific project depends on three factors working together:
- Load profile: How quickly does peak demand rise, and for how long must the battery sustain it? A gradual ramp over 30 minutes requires a very different C-rate than a sudden 10-second spike.
- Battery chemistry: LFP handles higher C-rates more gracefully than NMC or lead-acid. Match the chemistry to the application’s power demands before optimizing for cost.
- Project lifespan targets: If the project is financed over 20 years, designing for a lower C-rate and accepting a larger battery bank often produces a better levelized cost of storage than specifying a smaller, harder-worked system.
Getting these variables right requires accurate load data, a clear understanding of the battery’s datasheet performance curves, and the ability to model how the system will behave across different operating scenarios. For engineering teams working on complex C&I or utility-scale projects, this level of analysis is exactly where structured design tools make a measurable difference. If you are working through a battery sizing challenge on a current project, our team at Virto Solar is happy to discuss how automated design workflows can support that process.
Ultimately, there is no universal C-rate answer. The right specification is the one that balances power delivery, energy capacity, cycle life, and project economics for the specific application in front of you. Starting from the load profile and working backward through the C-rate requirements is the most reliable path to a system that performs as designed from day one through the end of its service life. Explore how Virto Solar’s tools support that kind of rigorous, calculation-driven approach to PV and storage design.
Frequently Asked Questions
How do I find the right C-rate for a battery if the datasheet doesn’t clearly specify it?
Start by looking for the capacity test conditions section of the datasheet, which should list the current (in amps) at which the rated capacity was measured — divide that current by the rated capacity in amp-hours to back-calculate the C-rate. If the datasheet is ambiguous, contact the manufacturer directly and request the performance curves showing capacity versus discharge rate. Reputable manufacturers will provide these; if they don’t, that’s a red flag worth factoring into your product selection.
Can I mix batteries with different C-rate ratings in the same system?
Technically possible in some configurations, but generally not recommended for commercial or utility-scale systems. Mixing batteries with different C-rate ratings creates imbalanced loading, where the lower-rated units are pushed beyond their limits while the higher-rated ones are underutilized, accelerating degradation unevenly across the bank. If your application genuinely requires both high-power bursts and high-energy capacity, a better approach is to use a single chemistry rated for the higher C-rate and size the bank to keep normal operating rates conservative.
How does temperature affect C-rate performance in real-world installations?
Temperature has a significant impact on both the usable capacity and the safe operating C-rate of a battery. At low temperatures, internal resistance increases, which means the effective C-rate ceiling drops — a battery rated at 1C at 25°C may only safely sustain 0.5C at 5°C without triggering thermal protection cutoffs. For outdoor or poorly climate-controlled installations, always derate the C-rate assumptions in your sizing model to reflect the actual ambient temperature range at the site, and verify that the battery’s BMS is configured to enforce those limits automatically.
What’s the most common C-rate mistake engineers make on their first commercial storage project?
The most frequent mistake is sizing the battery bank based on nameplate energy capacity alone and then selecting an inverter sized to the same number — without checking whether the battery’s continuous C-rate can actually support the inverter’s full output power. This results in a system where the inverter can theoretically output more power than the battery can safely deliver, causing the BMS to throttle output during peak demand events. Always verify that the battery’s continuous C-rate multiplied by its usable capacity equals or exceeds the inverter’s rated AC output before finalizing the design.
Does the C-rate change over the battery’s lifetime as it degrades?
Yes — as a battery ages and its usable capacity decreases, the effective C-rate of the system increases if the load profile stays the same. For example, a battery bank that starts life operating at 0.5C will be operating closer to 0.65C once it has degraded to 75% of its original capacity, assuming demand hasn’t changed. This is an important reason to build in capacity margin at the design stage: a system that starts at a conservative C-rate will still be operating within acceptable limits at end of life, whereas one designed right at the C-rate limit will be over-stressing the battery well before the warranty period ends.
How does C-rate factor into battery warranty claims if a system underperforms?
Most battery warranties specify the cycle life and capacity retention guarantees only at a defined C-rate, state of charge range, and temperature window. If your system’s actual operating logs show that the battery was regularly discharged above the warranted C-rate, the manufacturer can use that data to deny or limit a warranty claim. This makes it essential to log real-time discharge current data from commissioning onward, and to set BMS limits that enforce the warranted C-rate ceiling — not just the physical maximum the battery can handle.
Are there software tools that automatically account for C-rate when sizing a battery system?
Yes, and using them is strongly recommended for anything beyond a straightforward residential system. Purpose-built solar and storage design platforms can model the interaction between load profiles, battery C-rate curves, inverter sizing, and degradation over time in a way that manual spreadsheet calculations rarely capture accurately. These tools allow engineers to run multiple scenarios quickly — for example, comparing a smaller high-C-rate battery bank against a larger conservative-C-rate design — and evaluate the trade-offs in terms of both performance and levelized cost of storage before committing to a specification.
Related Articles
This content was generated with the help of AI — it may contain mistakes
Source link