

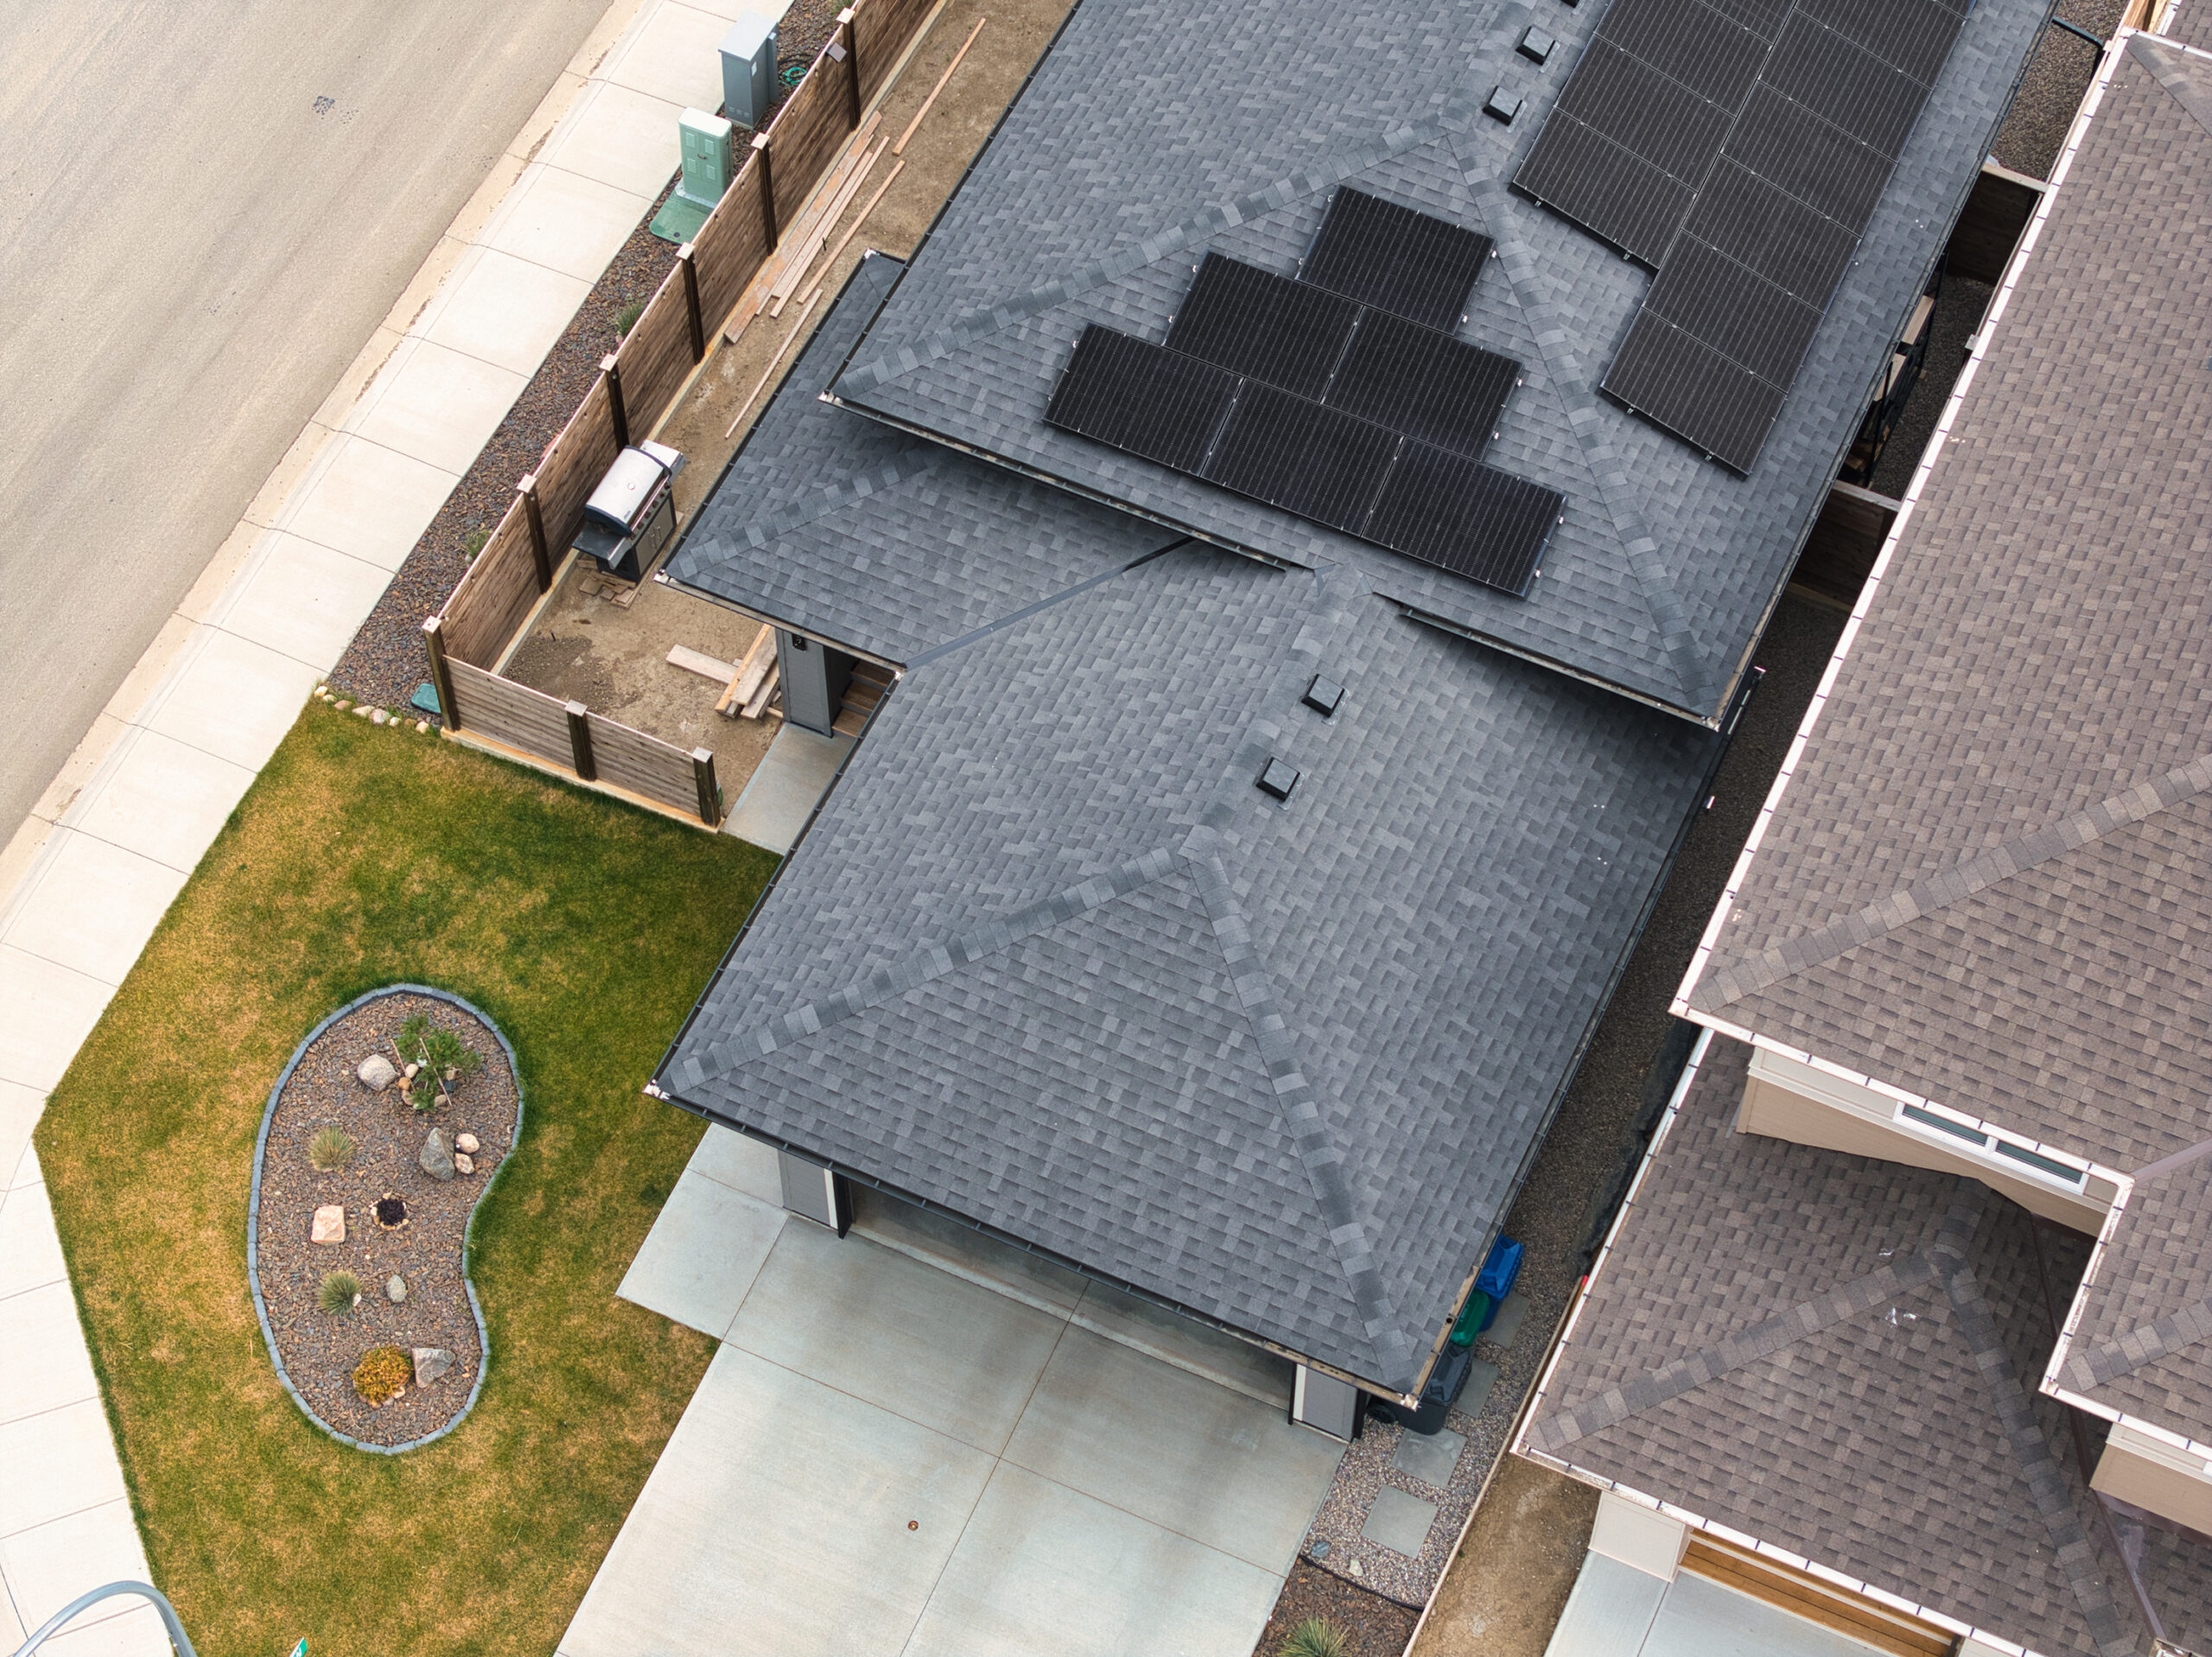
Canada’s trade tribunal has scrapped the extra import taxes it had been charging on Chinese solar panels since 2015. The United States is going the other way, adding tariffs that now reach right up the supply chain to polysilicon. For the first time in a decade, installers in Canada and the United States are buying equipment under completely different rules.
For Canada, cheaper panel imports are good news. But if you sell solar somewhere cold, the real question is simpler: once a panel is on a roof, how much power does it produce? Firefly Solar tracks the performance of more than 4,100 home solar systems in real time, panel by panel. Most are in Alberta, with smaller groups in Nova Scotia, British Columbia and New Brunswick. Here’s what they’ve taught us.
Alberta rooftops
For this analysis, we focused on a clean sample of 573 Alberta systems with an uninterrupted monthly record for all of 2025. The average rooftop system generated 1,309 kWh of electricity for every kilowatt of panels. Most landed somewhere between 1,170 kWh/kW and 1,469 kWh/kW – that’s across roofs facing south, east and west.
To put that in context, the European Commission’s free solar calculator, PVGIS, predicts 1,030 kWh/kW for a perfectly angled, south-facing rooftop in Frankfurt, and 972 kWh/kW in London. Everyday Alberta roofs, facing all kinds of directions, generated on average close to 25% more than an ideal German roof is expected to. High elevation, dry air and long summer days do a lot of the heavy lifting.
Where you are in Canada matters, too. From January to August 2026, our typical Alberta system made 987 kWh/kW. In Nova Scotia, it was 773 kWh/kW – that’s a 28% gap.
Winter performance
February 2025 put all of this to the test. Temperatures in Calgary remained below freezing from Jan. 31 to Feb. 19, with daytime highs as low as −24.5 C and fresh snow most days.
The cold isn’t the problem. Solar panels actually work better when they’re cold. Snow that never melts is a different story. From Feb. 4 to 19, the typical system in our fleet generated between 0.04 kWh/kW and 0.14 kWh/kW a day, which is next to nothing. On Feb. 5, 88% of systems generated less than 0.1 kWh.
Then a “chinook” rolled in. That’s the warm, dry wind that blows down off the Rocky Mountains, and it took Calgary’s daytime high from −17 C one day to 3.7 C the next. The snow slid off, and within three days the typical system was back above 4 kWh/kW a day. That’s about two-thirds of a normal June day.
The same 533 roofs produced on average 63 kWh/kW in February 2026, but only 35 kWh/kW in the frozen February of 2025. That’s about 29 kWh/kW lost, or roughly 2% of a full year’s output. Three weeks of deep freeze, and the year barely noticed.
That February points to the biggest lesson in our data: solar in Canada is a lot more seasonal than many expect. In 2025, November to February added up to just 9.8% of our fleet’s yearly power, while May to August made 54%. The typical system made 17 kWh/kW in December and 186 kWh/kW in June.
Standard solar calculators often miss this because they don’t account for snow. PVGIS says a Calgary roof should produce 14% to 21% of its yearly power between November and February, depending on which way it faces. A calculator can get the yearly total about right, while being far too optimistic about winter.
Over several months though, output is remarkably steady. From January to August, the 533 systems we could compare made within 2% of the same kWh/kW in 2025 and 2026, even though individual months swung by as much as 84%.
Cheaper panels
Dropping Canada’s import tariff removes a cost, but don’t expect every solar panel in Canada to get cheaper overnight. Some savings will get absorbed before they reach customers, and panels are only part of a system’s price. Labor, permits, sales and financing then make up much of the rest.
The bigger shakeup for residential solar in Canada came a year earlier, when the federal Greener Homes program wound down in October 2025. It had helped put solar on more than 50,000 homes. You might expect demand to have dropped off after that. It didn’t. From January to August 2026, the number of new systems connected to our monitoring was 39% higher than in the same months of 2025. The performance case is already made: at 1,309 kWh/kW, Alberta roofs beat what the models predict for Germany and the United Kingdom. Cheaper panels help. Bringing down the other costs, and being honest with homeowners about winter, helps even more.
Lessons for snow
If you install solar in the northern US, Scandinavia, or anywhere snow sits on roofs for weeks, two things from our experience carry over. First, be upfront about winter. Tell a homeowner their system will make about 10% of its June output in December, and they’ll be happy when it does. Tell them to expect 20%, and you’ll be getting a phone call.
Second, use panel-level monitoring to tell the weather apart from real problems. If every system dips at once and bounces back on the first warm day, that’s snow. If one system stays down after the thaw, it’s time to send someone out.
Trade rules now split Canada and the US. The physics doesn’t. A well-built solar system on the prairies is productive and reliable, and with the tariffs gone, it may soon cost less to install. Winter isn’t a dealbreaker. It’s just part of the plan.
The post Cold calculations appeared first on pv magazine Global.
Source link