
Output from Australia’s large-scale renewable energy sector continues to climb with the nation’s utility PV and wind assets generating a total of 5.0 TWh in February, delivering an 11% increase on the same time last year.
The latest data from Rystad Energy shows that Australia’s growing fleet of large-scale solar and wind assets generated 5.0 TWh of clean energy last month, up 11% from 4,519 GWh recorded in February 2025.
Rystad senior analyst David Dixon said New South Wales (NSW) was the biggest contributor to the month’s total with the state’s utility-scale solar assets generating 853 GWh of clean energy while its wind assets produced 617 GWh – a total of 1,470 GWh.
The top-performing utility solar assets for the month, based on capacity factor (CF), were however in Western Australia with Sun Energy’s 100 MW Merredin Solar Farm and the Potentia Energy and Synergy co-owned 40 MW Greenough River Solar Farm taking the top two spots with 41.2% CF and 38.0% CF respectively.
The third best rating solar farm for February 2026 was Cimic Group’s 102 MW Glenrowan Solar Farm in Victoria with a capacity factor of 37.2%. Neoen’s 36 MW Griffith and Metka EGN’s 30 MW Corowa solar projects in regional NSW rounded out the top five.
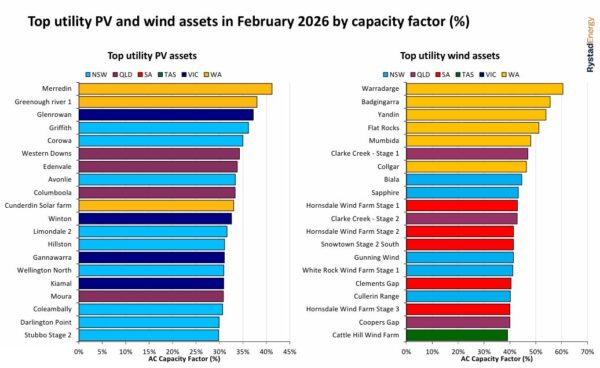
Western Australia is also home to the top-performing wind assets for the month with the Warradarge (60.5 % CF), Badgingarra (55.6 % CF) and Yandin wind farms (53.9 % CF) topping the charts.
Dixon also highlighted the increasing presence of battery energy storage systems in the Australian energy landscape, pointing out that discharging from batteries reached 245 GWh in February for the National Electricity Market, up 266% from the 67 GWh in the corresponding month last year.
This comes as new capacity continues to enter the market, with 8.2 GW of utility battery capacity at various stages of commissioning or in operation.
In New Zealand, utility solar and wind assets producing 294 GWh of clean energy last month, a 28% increase from 230 GWh in February 2025.
The top-performing utility solar assets were Lodestone Energy’s 32 MW Rangitaiki and 33 MW Kaitaia solar farms with 29% CF and 28% CF respectively, ahead of Genesis Energy’s 47 MW Lauriston solar farm with a capacity factor of 26%.
Meridian Energy’s Mill Creek wind farm (40%) was the top performing wind asset, ahead of Mercury NZ’s Tararua (35%) and Turitea wind farms (32%).
This content is protected by copyright and may not be reused. If you want to cooperate with us and would like to reuse some of our content, please contact: editors@pv-magazine.com.
Popular content
Source link