
Reviewed by Max Harris, Quality Assurance Electrician for GreenLancer
A solar energy diagram is a critical part of planning and installing a solar system. These visual tools serve as a roadmap for solar installers, engineers, and even homeowners, clearly showing how the system functions, from energy production at the panels to power delivery through the inverter and grid connection. A well-crafted solar diagram or solar panel diagram helps avoid design errors, ensures code compliance, and supports safe system operation. When you’re working with a grid-tied system, an on-grid solar system diagram shows how solar interacts with utility power and backup storage.
At GreenLancer, we’ve spent over a decade perfecting the accuracy of solar panel system diagrams and plan sets. Our engineering reviews and permit-ready documentation help streamline approvals, avoid costly revisions, and keep your projects moving forward. Create a free account to start ordering engineering services and solar panel diagrams that meet AHJ requirements across the country.
Types of Solar Energy Diagrams
Each solar energy diagram serves a specific purpose during the planning, permitting, and installation phases of a solar project. From visualizing system layout to documenting electrical connectivity, these diagrams are essential tools for system accuracy, code compliance, and project approval.
Single-Line Diagram (SLD)
A single-line diagram (SLD) is one of the most critical types of solar panel diagrams. It provides a simplified schematic of the entire electrical system, showing how power flows from the solar panels through system components like combiner boxes, inverters, disconnect switches, and finally to the main service panel or utility interconnection point. Rather than showing every wire, it uses a single line to represent each current path, making it clean and easy to interpret.
This solar panel system diagram is required for most solar interconnection applications, especially in on-grid solar system designs. Utilities and AHJs (Authorities Having Jurisdiction) use the SLD to ensure the system complies with the National Electrical Code (NEC), utility guidelines, and local safety regulations. It’s often reviewed during permitting and is critical for passing inspections.
Electrical Line Diagram
Often used interchangeably with an SLD (though sometimes less detailed), an electrical line diagram offers a high-level overview of electrical connectivity. It focuses on how major components like the solar array, inverter, and main service panel are interconnected, using symbols and one-line representations.
While not as detailed as a full wiring diagram, this type of solar panel diagram is frequently used for initial permit submittals or pre-application reviews. It’s a core part of any on-grid solar system diagram and provides enough information for utilities to evaluate system safety and integration feasibility.
Wiring Diagram
A wiring diagram is a more detailed solar diagram that shows every physical electrical connection—including wire sizes, colors, conduit paths, and terminal locations. It complements the SLD by offering granular information necessary for electricians to install the system correctly and safely.
This solar energy diagram is particularly useful during the construction phase and may be required in jurisdictions with strict inspection protocols. Wiring diagrams support compliance with NEC Articles 690 (for photovoltaic systems) and 705 (interconnected power production sources), helping avoid violations that can delay PTO (Permission to Operate).
Solar Panel Layout Diagram (Array Layout)
A solar panel layout diagram (also called an array layout) visually depicts the physical placement of panels on a roof or ground-mounted racking system. This type of solar energy diagram includes panel orientation (azimuth), tilt angles, spacing, and setbacks. It also highlights obstructions—like chimneys or vent pipes—that could cast shadows on the array.
For roof-mounted systems, the layout must comply with fire code setbacks (per NEC 690.12 and local building codes). For ground-mounts, the solar diagram may include site-specific data like soil classification, slope, and row spacing to optimize performance and prevent racking failure. This diagram is essential for maximizing solar exposure and ensuring structural and electrical code compliance.
System Monitoring Diagram
A system monitoring diagram is a type of solar panel system diagram that shows how data travels from the solar array to the monitoring platform. This solar diagram maps out the connections between modules, inverters, data loggers, sensors, and communication devices (like Wi-Fi or cellular gateways).
Real-time monitoring enables both installers and system owners to track performance metrics such as energy production, voltage, current, and inverter status. By identifying issues like inverter faults or reduced solar output, this diagram supports proactive maintenance—maximizing uptime and long-term energy yield. In on-grid solar system diagrams, monitoring components also track export to and import from the utility grid, which can affect NEM credits or time-of-use rates.
Shading Analysis Diagram
A shading analysis diagram is a specialized solar panel diagram used during the site assessment or design stage. It models the sun’s path throughout the year and simulates how objects like trees, chimneys, or nearby buildings will cast shadows on the array.
Created using tools like Aurora Solar, PVsyst, or Helioscope, this solar diagram includes sun paths, horizon lines, and monthly irradiance losses. Installers use it to position panels for maximum solar exposure while avoiding significant shading that can reduce system performance. It is especially critical in residential rooftop systems where space is limited and partial shading can impact multiple panels in a string.
Solar Roof Layout Diagram
The solar roof layout diagram provides a top-down view of where each panel will be installed on the rooftop. This solar panel diagram accounts for array dimensions, rafter/truss spacing, roof pitch, fire code setbacks, and obstructions like vents and skylights.
In roof-mounted on-grid solar system diagrams, this layout ensures structural load distribution is acceptable and that panel placement complies with fire and building codes such as IFC Section 1204 and NEC 690.12. These diagrams are also commonly submitted for permit approvals and utility interconnection.
Electrical One-Line Diagram
An electrical one-line diagram is a refined version of the single-line diagram, offering a more detailed breakdown of each component in the current path. This solar panel diagram illustrates how solar panels connect to combiner boxes, inverters, rapid shutdown devices, disconnects, and the main service panel—using standardized electrical symbols.
This type of solar energy diagram is especially important for commercial or grid-tied residential systems, where utility coordination, system size, and code compliance require clarity and precision. Installers use these diagrams to pass inspection and avoid costly revisions.
Solar Grounding and Bonding Diagram
A grounding and bonding diagram is a safety-critical solar diagram that outlines how all metal parts in the system are electrically connected and safely grounded. It includes the placement of grounding electrodes, equipment grounding conductors, and bonding jumpers between racks, inverters, and service equipment.
According to NEC Article 250 and 690.43, proper grounding helps mitigate shock hazards, reduce fire risk, and protect equipment from lightning or surges. This solar panel diagram is often required for larger systems or those in areas prone to electrical storms.
Solar Irradiance Profile Diagram
An irradiance profile is a planning-stage solar energy diagram that evaluates how much solar radiation a specific location receives on a daily, monthly, and annual basis. Using tools like LiDAR, solar maps, and meteorological data, this solar panel system diagram predicts expected energy generation based on panel tilt, azimuth, and potential shading.
Irradiance profiles are an especially useful solar energy diagram in the planning stages of a project, as they help in estimating the production capacity of solar panels and potential return on investment. Installers and designers use these profiles to optimize system design for maximum efficiency and ensure that the layout considers seasonal changes in sunlight availability. Additionally, these profiles support financial forecasts and are often required by utilities and permitting authorities to verify expected energy output.
Bill of Materials (BOM) Diagram
Although not a visual diagram in the traditional sense, a BOM diagram or list details every component in a solar installation. It includes solar panel models, inverters, mounting hardware, wire types, combiners, and rapid shutdown devices, with part numbers and specifications.
This document supports procurement, reduces errors in installation, and ensures compliance with permit submittals. It is often paired with a solar panel diagram to match components with their physical placement.
PV System Block Diagram
A PV system block diagram is a simplified, educational version of a solar energy diagram that shows how all major components interact. It includes solar panels, charge controllers (if off-grid or hybrid), inverters, batteries (optional), and the grid.
While it doesn’t replace an electrical on-grid solar system diagram, this block-level overview helps stakeholders visualize energy flow, including DC-to-AC conversion and grid tie-in. It’s especially useful during client presentations, training, or early-stage design discussions.
Additional Types of Solar Energy Diagrams
Beyond the core diagrams used in permitting and installation, several other solar energy diagrams are critical for more complex systems or jurisdictions with stricter requirements.
String Configuration Diagram
This solar panel diagram shows how modules are wired into strings and connected to inverters or combiner boxes. It ensures proper voltage and current levels, supports system efficiency, and is particularly important in on-grid solar system diagrams with string inverters.
Conduit and Wiring Layout Diagram
This solar diagram maps the physical path of wiring and conduit between major components. It’s helpful for installation planning and may be required by some AHJs for detailed permitting.
Rapid Shutdown Diagram
NEC 690.12 requires systems to safely shut down voltage at the array level. This solar panel system diagram illustrates where module-level shutdown components are installed and how they interact with inverters and disconnects.
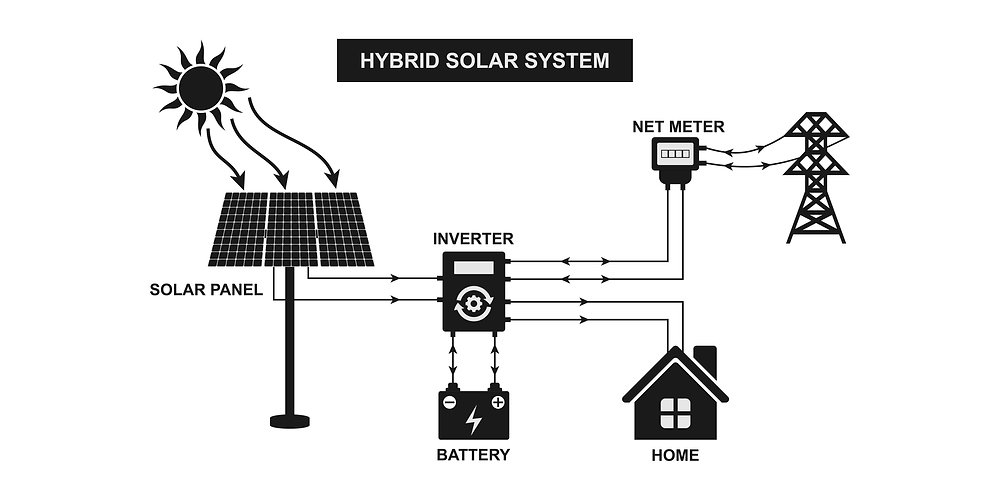
Battery Storage Diagram
For hybrid or backup-capable systems, this solar energy diagram shows how solar panels, batteries, and inverters interconnect. It’s essential for ensuring safe operation and compliance when designing battery-backed on-grid solar system diagrams.
Site Plan Diagram
Often part of a permit package, this solar panel diagram shows array placement in relation to rooflines, property boundaries, and electrical service points. It ensures compliance with fire access, zoning, and setback requirements.
A Solar Energy Diagram Vs a Solar Panel Diagram
A solar panel diagram specifically focuses on the layout, wiring, and components of solar panels within a system. A solar energy diagram encompasses a broader view, including energy flow, system connections, performance metrics, and overall solar power generation. Common solar panel diagrams include shading analysis diagrams, solar roof layout diagrams, electrical one-line diagrams, and PV system block diagrams.
Standard Symbols in a Solar Energy Diagram
A solar energy diagram follows specific standard symbols to maintain clarity and ensure that installers, engineers, and other professionals can easily understand the system layout. Symbols for components in a solar diagram are often standardized according to guidelines from organizations like the National Electrical Code (NEC) or the International Electrotechnical Commission (IEC). Knowing how to read these solar energy diagram symbols is crucial for anyone involved in solar system design or installation.
Key Components of a Solar Energy Diagram
When working with a solar energy diagram, understanding the key components and symbols is essential for designing and installing a solar power system. These solar drawings serve as blueprints that illustrate how all parts of the system connect and function together. Below is an overview of some of the most common components and their representations in a solar energy diagram:
Solar Panels
Symbol: A rectangle with lines or shading representing the photovoltaic (PV) cells inside
Purpose: Solar panels capture sunlight and convert it into electricity. In a solar energy diagram, it often appears as the primary component and is connected to other systems like inverters and junction boxes.
Solar Inverters
Symbol: A rectangle, sometimes with a wave or sine wave graphic inside
Purpose: Inverters convert the DC (direct current) electricity generated by the solar panels into AC (alternating current) electricity used by the home or business. In a solar diagram, inverters are shown connected to the panels and electrical distribution systems.
Junction Boxes
Symbol: A square or rectangular box with terminals or connections inside
Purpose: Junction boxes play a crucial role in a solar energy diagram by housing the electrical connections between components, such as solar panels and the inverter. They help ensure safe and efficient power transmission while protecting electrical components from environmental damage.
Solar Batteries
Symbol: A rectangle with a positive (+) and negative (-) terminal
Purpose: Batteries store excess energy generated by the system, allowing for backup power when sunlight is unavailable. In a solar diagram, they connect to the inverter and often include charge controllers for managing battery health.
Utility Meters
Symbol: A small circle or rectangle, often with a “meter” label
Purpose: Meters are used to measure the energy production of the solar system (production meter) or the energy consumed from the grid (utility meter). These are crucial for monitoring energy generation and ensuring compliance with net metering programs.
Breakers and Disconnects
Symbol: A small rectangle with lines indicating a switch or circuit
Purpose: In a solar energy diagram, breakers and disconnects serve as crucial safety features, allowing installers or homeowners to isolate specific parts of the system for maintenance or emergency shutdowns. They help prevent overcurrent and protect the system from potential damage.
Combiner Boxes
Symbol: A rectangular box with multiple inputs and one output
Purpose: Combiner boxes combine the outputs from multiple solar panels or strings of panels before sending the electricity to the inverter. This simplifies wiring and protects the system by centralizing connections.
Solar Energy Diagrams and Permitting
A solar energy diagram is essential for both accurate system installation and a smooth solar permitting process. These visual documents clearly represent how a solar system is designed—showing component placement, wiring paths, and key interconnections. Whether it’s a solar diagram for wiring or a full solar panel system diagram, these drawings are required by most AHJs to ensure compliance with local building and electrical codes.
High-quality solar panel diagrams reduce the risk of permitting delays by detailing system configurations in a code-compliant format. This includes layout, conduit paths, inverter connections, and grounding—all crucial for meeting NEC and utility standards. An accurate on-grid solar system diagram also simplifies communication with inspectors and utility engineers, helping installers get faster approvals and avoid costly revisions.
Source link