
For most of the past four decades, French nuclear has been the closest thing Europe had to a real baseload backbone. Reactors ran flat through the day, only reducing output at night, when domestic demand was lowest. Hourly data from the ENTSO-E Transparency Platform show that pattern has flipped. Between 2019 and 2025, the average swing between midday and evening output across the April to September window grew from 582 MW to 4,426 MW. That is close to an order of magnitude. During the hours when European solar is at its peak, French reactors are no longer behaving like baseload.
Nuclear modulation in France, where reactors operate below their maximum capacity, reached 33 TWh in 2025, more than double the 15 TWh recorded in 2019. The shift is unambiguous in both the annual totals and the hour-by-hour flows. The diurnal price shape Europe has been forecasting for the late 2020s has already arrived in France.
An order-of-magnitude change, year by year
The graphics below plot full-year diurnal averages of French nuclear output, solar generation, total load and net exports for three reference years: 2019, 2023, and 2025. The 2019 nuclear curve is flat across the day. The 2023 curve sits lower, with the fleet still recovering from the maintenance outages caused by the 2022 stress-corrosion issue and is only mildly concave. The 2025 curve is, however, unambiguously concave. It shows a clear midday dip relative to morning and evening levels. The same panel shows the inverse on the solar side. The 2025 solar curve peaks during exactly those midday hours, and the 2025 net export curve peaks at the same time, when the rest of Europe takes the surplus.
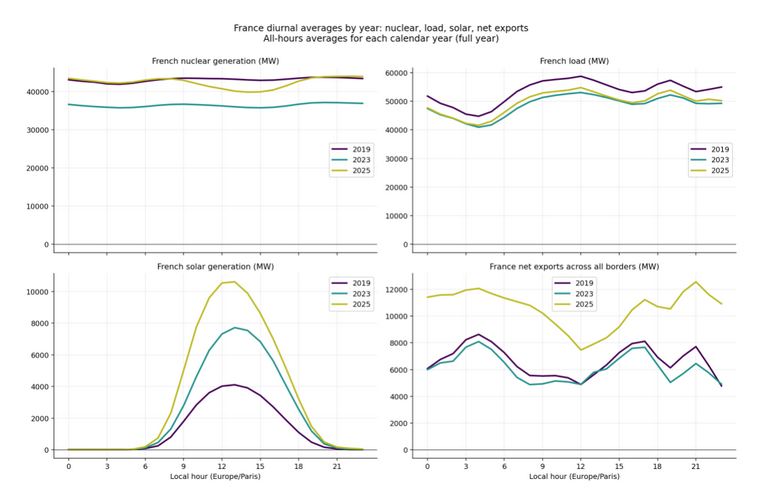
Image: Ricardo PLC
Strip out winter, when there is little solar, and the signal sharpens. Across April to September, the gap between average French nuclear output in the midday window (10:00 to 16:00 local time) and the evening peak window (18:00 to 22:00) grows from 582 MW in 2019 to 4426 MW in 2025.
Q1 2026 data, while not directly comparable to summer numbers, are already showing a midday-to-evening differential of around 2,500 MW. That is large for winter in Northwest Europe, when solar is at its annual minimum. The change between 2022 and 2025 cannot be explained by maintenance scheduling. The 2022 dip reflects the stress-corrosion crisis, but after that the gap widens each year.
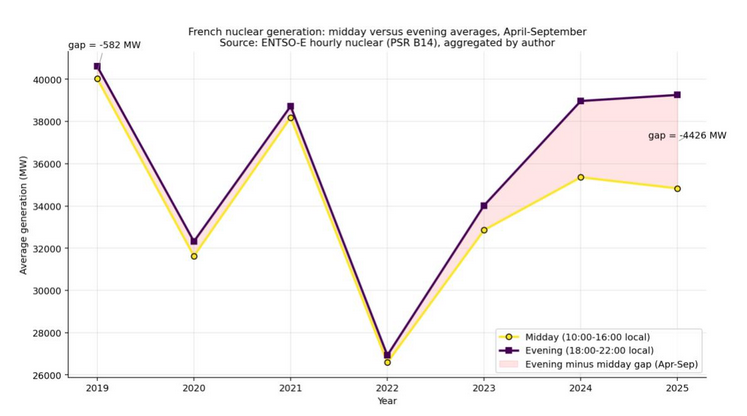
Image: Ricardo PLC
The shift has two components: a larger annual volume of modulation, and a change in when that modulation occurs during the day. The fleet used to bend at night, triggered by lower domestic load. It now bends at midday and in the afternoon, triggered by high levels of European solar generation. The price side tells the same story. What used to be a midday plateau in French wholesale prices is now a midday trough.
Economic dispatch, not a capacity constraint
France was a net exporter in 98.5 percent of hours in 2025. The annual export balance reached 92.3 TWh, the highest on record and comparable to annual electricity consumption in a country like Belgium. The fleet is not under-running because it has nothing to produce.
What changes is the marginal decision in the hours when the fleet does not run flat out. In the 129 hours of 2025 when France was a net importer, French nuclear ran on average 8.7 GW below its annual mean. The equivalent gap in 2024 was effectively zero. Import hours no longer signal scarcity at home but rather cheap renewable surplus abroad. The average import price across 2025’s import hours was 33 euros per MWh, the lowest since the markets opened, and roughly half of those hours cleared at negative prices.
For anyone modelling French nuclear margins on the 2019 price shape, the inversion is fundamental. An import-bound hour for France used to be a high-price hour driven by domestic scarcity. In 2025 it is a low-price hour driven by foreign abundance.
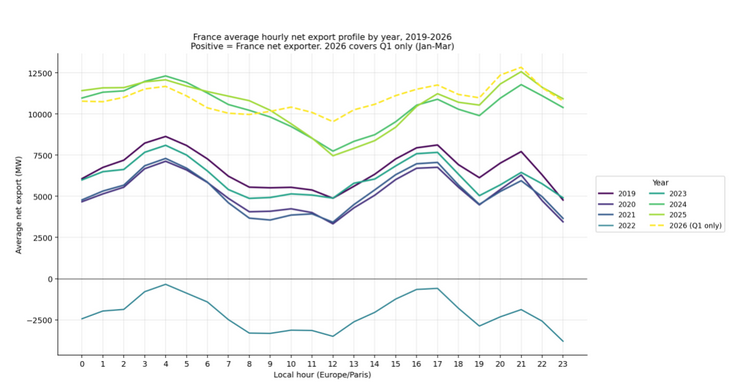
Image: Ricardo PLC
The Spanish border showed up first
The clearest cross-border view of the shift is Spain. Through 2021, France was a near-permanent net exporter to Spain. The 2022 nuclear crisis flipped that, with Spanish exports backing up France through to early 2023. Since 2024, the balance has been close to zero, just 0.2 TWh net in 2025, made up of 7.6 TWh of French exports against 7.4 TWh of imports.
What matters is when the net export months appear. As illustrated in the chart below, in 2024 and 2025 they cluster in February to April, the months when Spanish solar is already producing materially but Spanish demand has not yet ramped up for summer cooling. That is the temporal fingerprint of bidding-zone solar saturation. It has appeared in the Spanish zone before Spain has reached the installed capacity that several other European markets are targeting for 2030.
France is not exporting less because it is producing less. It is exporting less because, for many hours, Spain has cheaper electrons. The same dynamic will appear at any border where solar penetration on the far side outpaces local storage and demand flexibility.
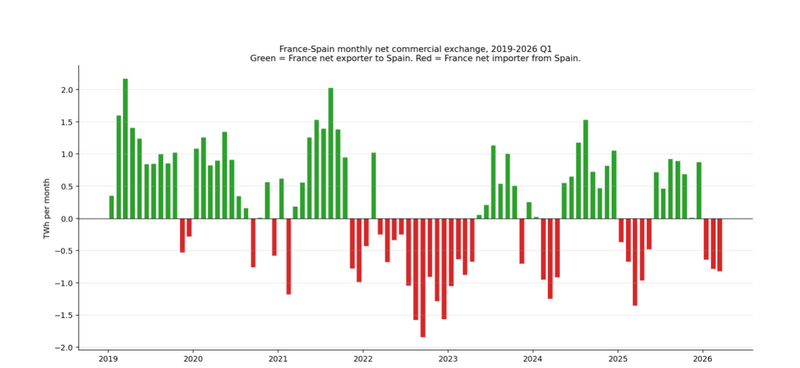
Image: Ricardo PLC
The Italian border still looks like the Spanish border did around 2018. France exported 26.2 TWh net to Italy in 2025, with Italian wholesale prices averaging 116 euros per MWh against 61 euros per MWh in France. The Italian generation mix remains gas-heavy. Whether that stays the case as Italian solar capacity grows is one of the genuinely open questions for the second half of the decade.
What to watch…
Three things to track over the next couple years.
1. Does the Italian border start to show Spanish-style early-spring imports into France? Italian solar capacity, gas pricing and battery build-out are the variables. The Spanish precedent shows the turn can happen quickly once the conditions align.
2. How does French nuclear modulation grow as a share of fleet output? 2025’s 33 TWh is roughly 9% of total French nuclear generation of 373 TWh. The nuclear fleet has not yet had to manage modulation as a double-digit share of annual output.
3. How German solar shapes cross border flows? As Germany’s solar fleet continues to expand rapidly, periods of low-cost solar generation are already reshaping commercial power flows across the region. As more renewable capacity comes online, these effects are likely to intensify, with potential direct and indirect implications for nuclear output modulation in France.
Author: Safa Sen, Market Engagement Lead For CWE at Ricardo, Member of WSP.
Ricardo is a member of professional service firm WSP Group, uniting engineering, advisory and science-based expertise to shape communities to advance humanity. From local beginnings to a globe-spanning presence today, it operates in over 50 countries and provides solutions and delivers innovative projects across sectors: Transport & Infrastructure, Property & Buildings, Earth & Environment, Water, Power & Energy and Mining & Metals.
How Ricardo’s Electricity Market Outlook can help
How fast will your bidding zone follow Spain into midday saturation? When will negative-price hours start eating your asset’s capture rate, and by how much? What CfD strike price holds up when the merit order is being repriced hour by hour by neighboring solar?
Ricardo’s Electricity Market Outlook (EMO) is built to answer those questions. The underlying model, PRIMES-IEM, sits behind two decades of European Commission policy analysis. It runs all European markets simultaneously to 2050, with cross-border flows derived by replicating the EUPHEMIA algorithm used by ENTSO-E.
Outputs cover hourly prices, capture rates, negative-price depth and frequency, curtailment exposure, and BESS profitability projections at country and asset level. These are the quantitative inputs that CfD bid pricing and project bankability cases require.
The views and opinions expressed in this article are the author’s own, and do not necessarily reflect those held by pv magazine.
This content is protected by copyright and may not be reused. If you want to cooperate with us and would like to reuse some of our content, please contact: editors@pv-magazine.com.
Popular content
Source link