

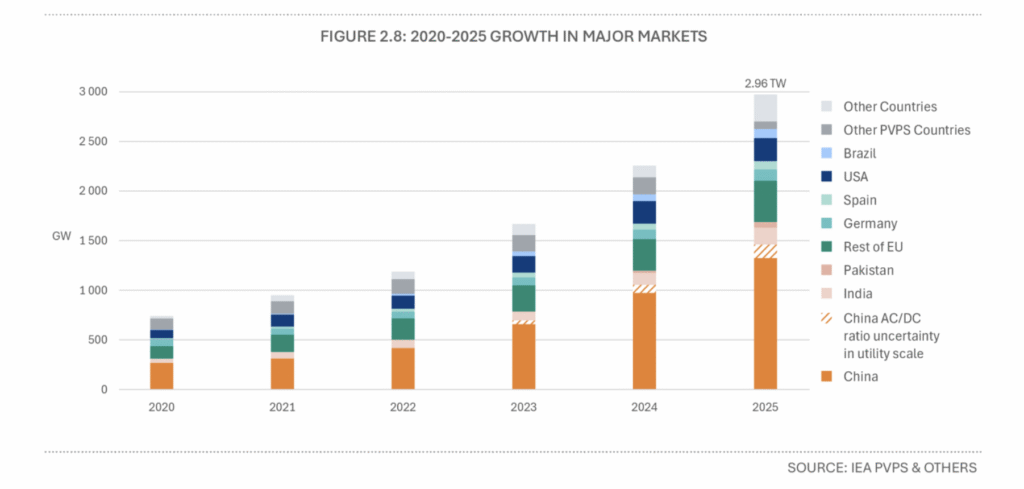
Global solar additions reached around 690 GW in 2025, according to the latest report from the International Energy Agency’s Photovoltaic Power Systems Programme (IEA-PVPS).
IEA-PVPS’ Trends in Photovoltaic Applications 2026 report reveals last year’s additions represented a 15% increase on installations during 2024.
By the end of last year, cumulative installed solar capacity reached 2.96 TW. The report says this capacity could theoretically generate around 3,845 TWh annually, equivalent to approximately 12% of global electricity consumption.
China installed 415 GW, or 60%, of global installations last year. India ranked second for annual additions, at 54 GW, followed by the United States (43 GW), Germany (18 GW) and Pakistan (14 GW). Collectively, the European Union added 68 GW.
The report notes that PV deployment continued to broaden geographically, with 36 countries installing more than 1 GW of solar, three more than in 2024.
Centralised solar systems accounted for 410 GW of new solar systems last year, led by China (256 GW), India (42 GW), USA (35 GW), Spain (11 GW) and Germany (8.3 GW). The report also notes Saudi Arabia and the UAE’s as growing markets that are driven by centralised systems.
Distributed solar accounted for 282 GW of new installations in 2025, a record for the market segment, up from 228 GW in 2024.
China deployed 159 GW of all distributed solar last year, followed by Pakistan (14 GW), India (12 GW), Germany (9.2 GW) and Brazil (7.9 GW). The report lists France, Türkiye, Japan and Australia as other countries where the distributed market is driving overall growth.
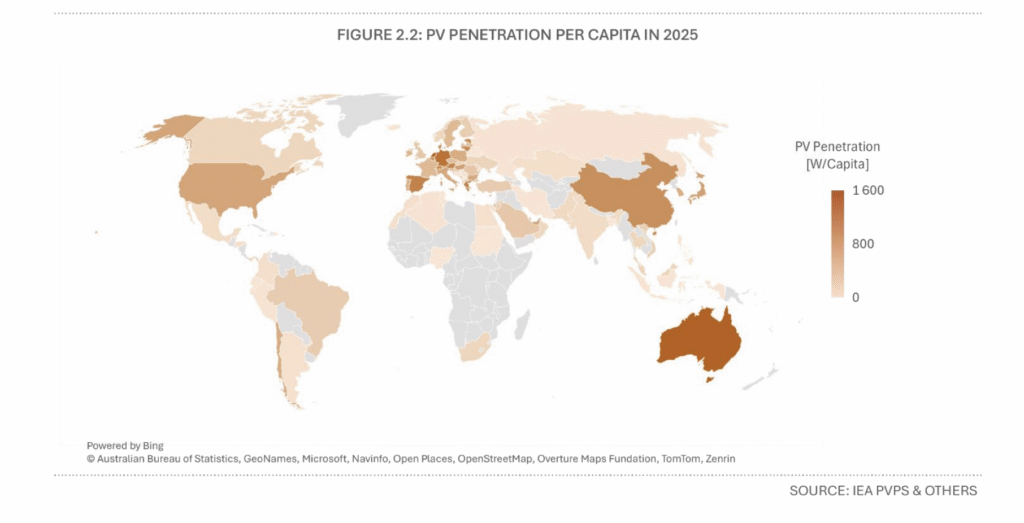
Last year saw Australia surpass the Netherlands as the country with the highest cumulative installed PV capacity per inhabitant, with 1,604 W/cap compared to 1,584 W/cap. Germany ranks third in this metric, with 1,413 W/cap.
An additional eight European countries – Spain, Greece, Austria, Denmark, Lithuania, Estonia, Switzerland and Belgium – are above 1,000 W/cap. China’s penetration rate also moved beyond this threshold, to stand at 1,040 W/cap.
In the report’s forward, co-managers of IEA-PVPS Task 1, Melodie de l’Epine and Izumi Kaizuka, and IEA-PVPS chair, Daniel Mugnier, wrote that last year’s deployments “continued alongside significant industrial imbalance.”
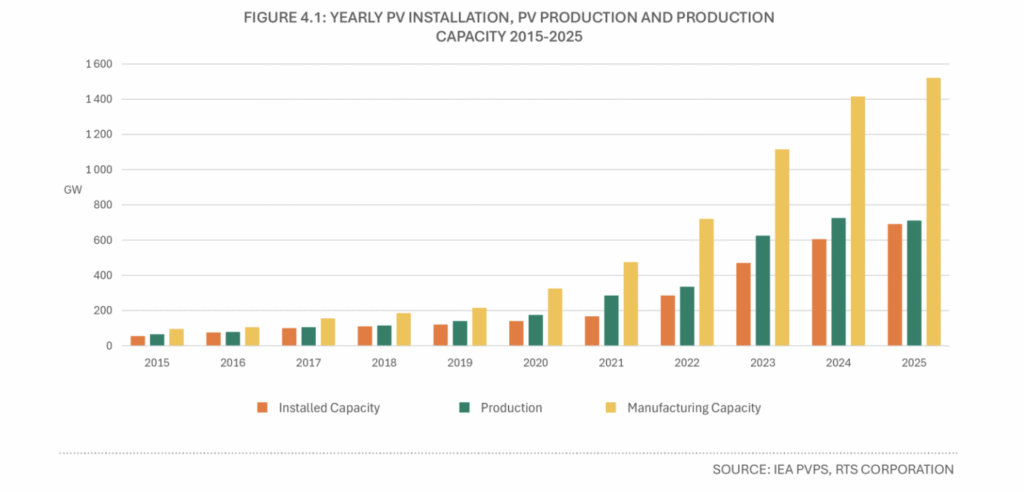
They explain that module production remains above annual installations figure, while low utilisation rates, continuing price pressure and weak profitability impact manufacturers throughout the value chain.
Figures from the report state that global production of solar modules reached 722 GW last year, a 0.6% decrease on 2024. This represents a slowdown on the 61.7% year-on-year growth recorded between 2022 and 2023.
China accounted for 79% of global PV module production last year. The country’s global share dropped from 86% in 2024 as manufacturing capacity expanded in India and the USA.
Global PV module manufacturing capacity is estimated to have reached 1,531 GW/year last year, of which 71% was located in China.
de l’Epine, Kaizuka and Mugnier added that the scale of solar deployment is changing the relationship between solar capacity, electricity systems and electricity markets.
“Curtailment, negative prices, declining capture prices and grid connection constraints are more increasingly visible in high penetration markets,” they said. “Storage, flexible demand, stronger networks, improved forecasting and appropriate market access are becoming essential to extending the contribution of PV beyond the hours in which it generates.”
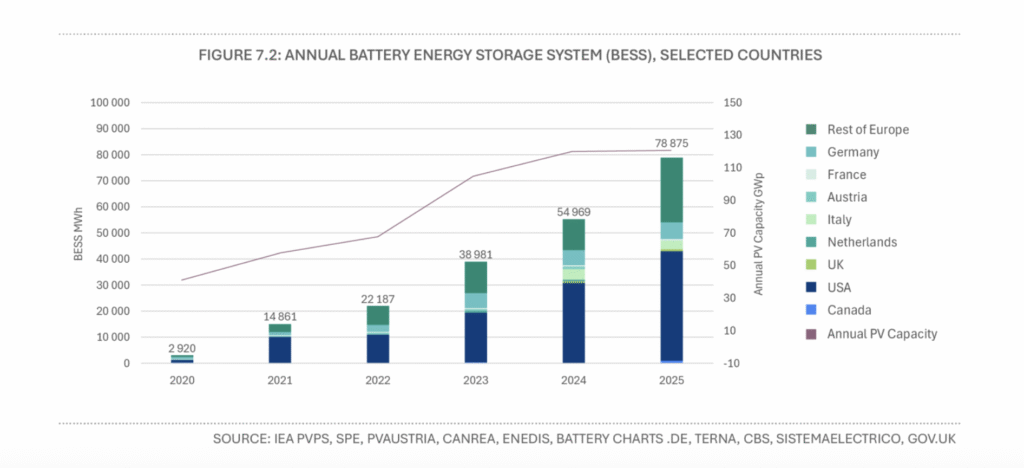
Additional figures from the report highlight the considerable growth in storage deployment. Annual battery energy storage capacity additions across Europe, Canada and the US combined have grown from 2.9 GWh in 2020 to almost 79 GWh in 2025, representing a more than 25-fold increase.
Source link